Latest UI UX Statistics You Need To Know In 2024
- UI/UX
- January 9, 2024
Want your digital product to look exceptional and attractive to users, earning their interest in your online platform and enhancing your business reputation? Then it’s a must to know some of the key UI UX statistics before you start designing your digital platform. Read this blog to learn how every decision you make towards digital product design impacts your results.
They say, “A seamless user interface is the silent ambassador of your brand, leaving a lasting impression on every interaction.” Indeed true. A well-crafted UI UX design goes beyond aesthetics and impacts usability, accessibility, and the overall user experience positively.
Even in the year 2024, User Interface (UI) and User Experience (UX) design will stand at the forefront, shaping the way we interact with technology. Not only professionals but UI UX statistics also back up this fact and emphasize the importance of a stunning and user-centric UI design.
In this blog, we have broken down the most relevant UI UX statistics and trends to keep you in the loop. These insights will help you understand the change in dynamics in the upcoming year.
Why Does Your Website or Mobile App Need an Appealing UI UX Design?
An appealing UI UX design is the cornerstone of a successful website or mobile app, serving as the digital ambassador that welcomes and guides users through their online experience. Beyond its aesthetic allure, a well-designed UI/UX fosters a sense of positive user interaction, professionalism, reliability, and trust.
According to Forbes, there are 5.16+ billion internet users across the globe. A huge part of the population interacts with websites and mobile apps daily. If we look at the stats, there were 1.13 billion websites in February 2023, but 82% were deactivated, and only 200 million websites are active currently. However, the number of users and websites is growing with each passing day.
One website is built every 3 seconds. Globally, 73% of businesses have launched their website till 2023. Approximately 94% of the initial impression users form about a website is attributed to its design. It’s crucial to ensure that the website is crafted in a manner that captivates users, as approximately 88% are unlikely to revisit a site following a poor experience.
First impressions are all about UI UX design. Apart from other reasons, UI/UX design also plays a pivotal role in attracting users initially, but also in retaining their interest over an extended period.
How UI/UX Influence User Engagement?
Crafting appealing UI UX design is essential for websites and mobile apps because it directly impacts user experience, engagement, satisfaction, and conversion rate. Here are some UI UX statistics that highlight the importance of a compelling design in digital products.
- According to Business Research Insights, the size of the worldwide UI market reached almost $1.6 billion in 2021, and it is expected to surpass $3.693 billion by 2028, exhibiting a Compound Annual Growth Rate (CAGR) of 15.01%. Similarly, the global UX market, valued at $6,120.44 million in 2021, is forecasted to expand to $20,058 million by 2028, with a projected CAGR of 16.24%.
- 94% of individuals think that a website reflects the brand reputation and the brand comes from how its website looks. Hence, a well-organized user interface and user experience design can really help your business do better.
- According to 94% of users, straightforward navigation is a paramount factor. Along with it, 83% of users say that maintaining an appealing and current website is equally essential to user satisfaction.
- In a recent study, it was found that a well-executed UI has the potential to amplify conversion rate by almost 200%, whereas, a seamless UX can yield an even more impressive increase of up to 400%.
- Gartner’s research reveals that 58% of consumers said that the majority of their digital interactions have minimal influence on their decision-making process when it comes to making purchases.
- Studies reveal that only 68% of internet users aged between 18-29 years feel at ease while using digital devices for online activities.

User Experience Statistics Supporting Conversion Rate Optimization
A positive user experience directly impacts conversion rates. If users enjoy interacting with your website or application, they are more likely to take desired actions, like make the purchase, send enquiries, book services or fill the contact form.
Even facts say that $1 invested in UX design brings an ROI of approx $100. Software development companies invest 20% of the total defined budget in UX design. Along with it, 74% of visitors may come back to the website only if it has a good mobile UX.
Also read: Top 9 UI Design Mistakes That Ruin Your Conversion Rate
On top of all, 90% of smartphone users claim that they’re more likely to continue shopping if the user experience is great for them.
Statistics on the Importance of Website/App Loading Times
In a digital landscape where competition is fierce, owning a website or app that loads quickly provides a competitive edge. Users are more likely to choose a platform that offers a seamless and speedy experience over slower alternatives.
According to UX statistics, when a page takes just one second longer to load, the number of people viewing the page decreases by 11%. Moreover, a one-second delay in loading may lower customer satisfaction by 16% and conversion rate experience by 7%.
A slow-loading website or app contributes to a higher bounce rate and may force visitors to leave the page without interacting further, whereas improved website speed can broaden the overall reach. UX design statistics prove this point.
- Slow-loading websites or apps can result in an annual business loss of approx $2.6 billion.
- A slow loading time prompts over 88.5% of website visitors to abandon the site.
- If a mobile site takes more than 3 seconds to load, 53% of visitors are likely to leave.
- Approximately 50% of digital users expect their favorite websites to load within 2 seconds.
Quick loading times contribute to a positive user experience. When visitors or users can access your website or app swiftly, they are more likely to stay, explore, and engage with your content. On the other hand, slow-loading pages can frustrate users, leading to higher bounce rates.
UI UX Statistics on Global User Preferences
User preferences in UI UX design trends can vary, but several common elements tend to contribute to a positive user experience. Here are some key factors to prove the statement.
Preference for Simplicity and Minimalism
Both simplicity and minimalism align with user preferences across diverse demographics. Studies say that more than 75% of Baby Boomers favor straightforward UI designs, while 78% of Millennials are drawn to minimalistic UI designs. By simplifying the interface and creating minimalistic design, designers reduce cognitive load, making it easier for users to navigate and interact with a product or platform.
Mobile-Centric Design
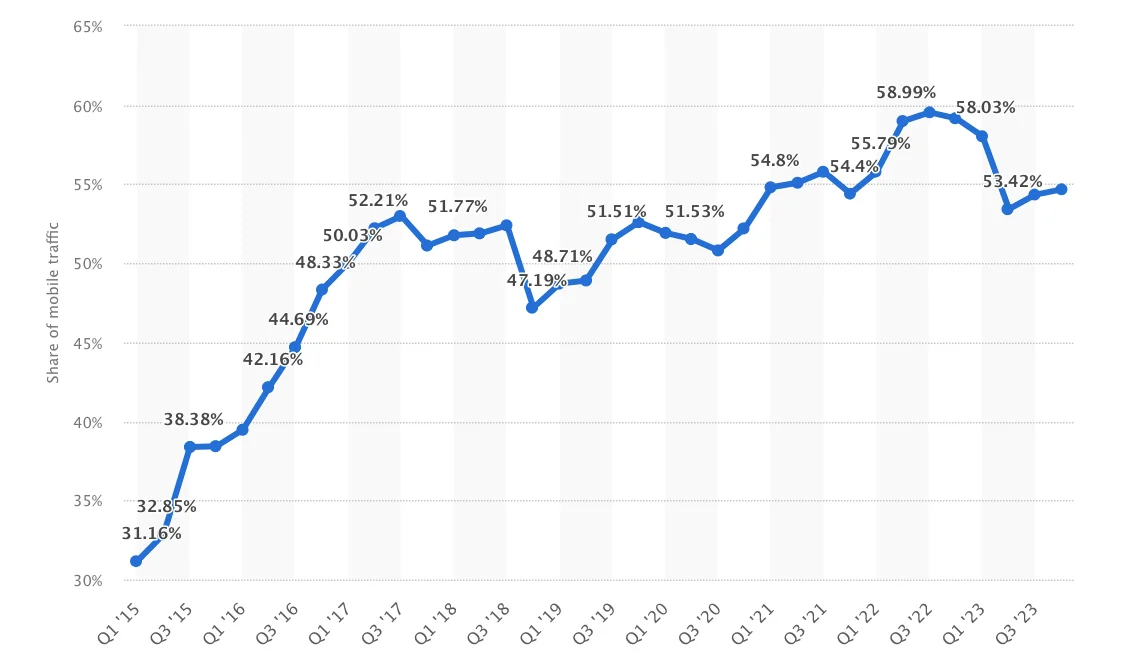
UX statistics states that almost 55% of internet traffic comes from smartphones and tablets, making mobile-centric design has become a necessity for business owners. That’s why websites and apps should be optimized for the varied screen sizes and touch interactions inherent in mobile devices.
Moreover, users spend 5 hours or more on their mobile scrolling through various platforms, apps and websites. Among these 45% of users prefer to see content that supports all screens.
Content Creation
Content creation and representation enhance digital presence. In this stage, UX content writers and UX strategists create and align content with the design to engage users with the website. User Experience statistics display that approximately 34.6% of users look for proper content structure, and they will leave the website if they do not find the perfect balance.
Additionally, 54% of website visitors anticipate online service providers to craft personalized content based on their interests. More than 70% of users desire companies to incorporate humor into design and content that resonates with them.
Design Responsiveness
The user interface design trends survey states that approximately 90% of digital users engage with multiple screens, and 98% of users switch from one screen to another. A study conducted by GoodFirms reveals that 73.1% of web designers attribute visitors leaving a website primarily to its non-responsive design.
Approximately half of web traffic worldwide comes from the mobile devices worldwide. As per Statista, in the last quarter of 2023, mobile devices generated 58.67% of global website traffic.

Hence, design responsiveness and mobile screen-friendliness are imperative to obtain growth, conversion and profits.
Design Usability
Approximately 60% of digital consumers regard the usability of digital platforms as a defining feature of web and app design. Other essential elements include search functionality, filter options, review capabilities, reduced loading times, and more.
UX Testing
UX testing helps identify areas of frustration or difficulty that users may encounter while interacting with a website, app, or product. Testing allows designers and developers to assess the overall usability of a digital product.
Also read: 6 Reasons Why a Bad UX Can Kill the App
It helps streamline navigation, improve layout, and ensure that users can easily accomplish their tasks. However, only 55% of businesses conduct UX testing and the rest businesses hardly take the benefits.

The Unique Edge MindInventory Brings to UI UX Design
MindInventory thrives on innovation and prides itself on staying ahead of design trends and technological advancements. Our designers are not just creators; they are visionaries who bring fresh and inventive perspectives to every project. They excel in creating intuitive, user-friendly interfaces that enhance the overall user experience.
While providing UI UX design services, we meticulously consider user behavior, preferences, and needs and craft designs that captivate and engage visitors. Our holistic approach ensures consistency across all touchpoints, reinforcing your brand identity and user experience. By choosing MindInventory, you’re not just selecting a UI UX design agency; you’re partnering with a team dedicated to bringing your vision to life.


