Mobile App Usage and Growth Statistics for 2024
- Mobile
- January 4, 2024
Since the adoption of smartphones, we’ve been using many mobile apps for many different purposes, including work-related, entertainment, performance tracking, and much more. But in the past few years, the mobile market has received many similar applications, and App & Play Stores are scraping many applications. Hence, entrepreneurs targeting to develop mobile apps must read this mobile app usage and growth statistics guide to plan their app development accordingly.
The world is changing, and everything is becoming easily available. Whether it is last-minute online shopping, mobile banking, or quick-accessible business CRM, we all heavily rely on mobile apps.
That’s the reason why, in this rapidly growing adoption rate of digital-first business, a mobility solution is becoming a motivating factor for leaders to bring innovations in mobile app development. And that factor is to unlock many business opportunities to shine in the market competition.
Nowadays, app stores are flooded with many likely app types, so it’s a must to explore mobile app development opportunities to make your app shine in the year 2024 and beyond by looking at trending mobile app usage statistics.
Why Does It Have To Be Mobile App Development?
With the increasing demand for mobility solutions and getting everything at their fingertips, the mobile app development market has been experiencing a massive elevation. Below are the facts stating the anent need and innovation in the mobile app industry.
Smartphone User Base
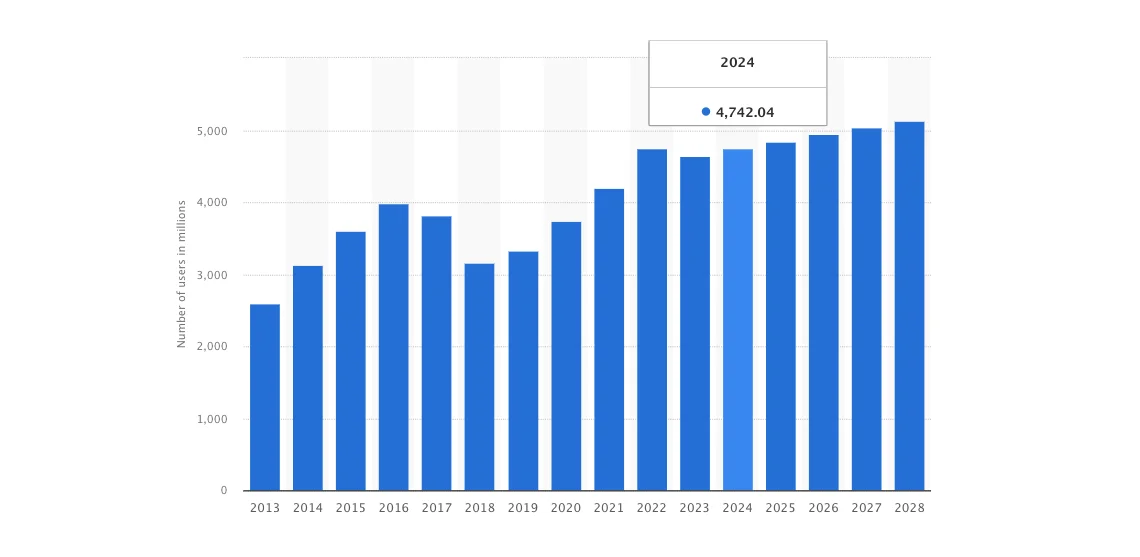
One study predicts that the number of smartphone users is expected to increase to 4.74 billion by the end of 2024, with a 2.2% annual increase. If we look at the increase in smartphone users from 2013 – 2024, the average growth is marked at 6.2% annually.
Android vs iOS Mobile Device Users
- Global Marketplace: When there is competition between Android and iOS mobile phones, Android mobile users indeed dominate the market with 69.7% of the market share globally as per the study conducted on Q32023.
- US Marketplace: If we see the US marketplace in the comparison of Android vs iOS mobile device users, the iOS mobile market receives a bit decrease from 57.3% in Q32023 to 56.4% in Q32023, yet leads the market.
- UK Marketplace: In the case of the UK mobile market, both the iOS and Android markets are closely competing with each other. In the Q3 2020 survey, Android mobile users were leading the market with a 53% user base, whereas in the Q3 2021 survey, the iOS mobile user base was counted at 51.6% and the Android user base with 47.8% share.
In the recent study Q32023, there were 51.3% iOS users and 48.1% Android users. Seems like there’s an opportunity for both native Android and iOS app development, even cross-platform app development using technologies like Flutter or React Native.
With such forecasting, it does make sense for businesses to build a mobile application to reach their maximum potential customers.
Smartphone Usage
In the public area, when you observe your surrounding people, you will clearly see how they are dedicatedly busy with their mobile activity.
One study found that, on average, a normal person spent around 4 hours 30 minutes a day checking smartphones in 2022. However, with increasing mobile applications, its usage time is expected to rise by 4 hours 39 minutes by 2024.
The reasons behind this increase in intensive smartphone usage are the digitalization of finance, shopping, management services, easy availability of entertaining materials through social media, and much more.
Mobile apps can become a great source for businesses to generate more revenue. As per the NASDAQ report, the NIKE mobile app played a vital role in improving its digital revenues by 4% on a reported basis and 1% on a currency-neutral basis.
Not just NIKE, but there are many brands, like IKEA and Starbucks, who have improved their sales with the help of mobile apps.
Mobile App Development & Download Statistics
When discussing mobile app development and download statistics, it is necessary to bring the Android and iOS app concepts along with Google Play Store and App Store.
Google Play Store
Google is the most trusted and highly used platform by the global audience base on a daily basis for even the smallest query search. As per one research, the community counted over 3.55 million android apps with 1.115 million app publishers on Google Play Store alone.
Although Google Play Store is removing low-quality & spamming apps from the store – its application numbers are rising every day. The Google Play Store gets updated with around 1,441 new mobile apps on a daily basis! These increasing app numbers have made Google Play Store the biggest mobile app store in the world.
As per the Business of Apps study, last year (in 2023), over 110 billion apps and games were downloaded from the Google Play Store.
Apple App Store
Apple App Store is the second largest and the close competitor of Google App Store, with a varying user base region-wise. You can get that data from the above section named “Android vs iOS Mobile Device Users.”
At the latest, in the App Store, there are 1.86 million iOS apps with 782K+ publishers available globally.
According to Statista’s latest survey, in Nov 2023, 38 thousand iOS mobile apps were released through the Apple app store.
Now, we will see the mobile app retention rates based on different app categories, which show users’ commitment to the application they download.
Mobile App Retention Statistics
When developing a mobile app, the major focus should be on the user retention rate. We understand that it is a bit harder to ensure higher user retention rates all time, but important to give different tactics a try.
Let’s first know the meaning of mobile app retention rate.
Well, the mobile app retention rate is calculated based on the measures like no. of users who continue to use the application after its installation. The more continued use of the application by the maximum users, the better the mobile app user retention rate. Basically, the mobile app user retention is calculated in the cycle of 30 days after a user installs the app on his/her mobile device.
The mobile developers’ community shares an average mobile app retention rate measured within 30 days:

If you look for mobile app development type and genre, then the user retention rate differs depending on the kind. Below are the average mobile app retention rates based on industry type:
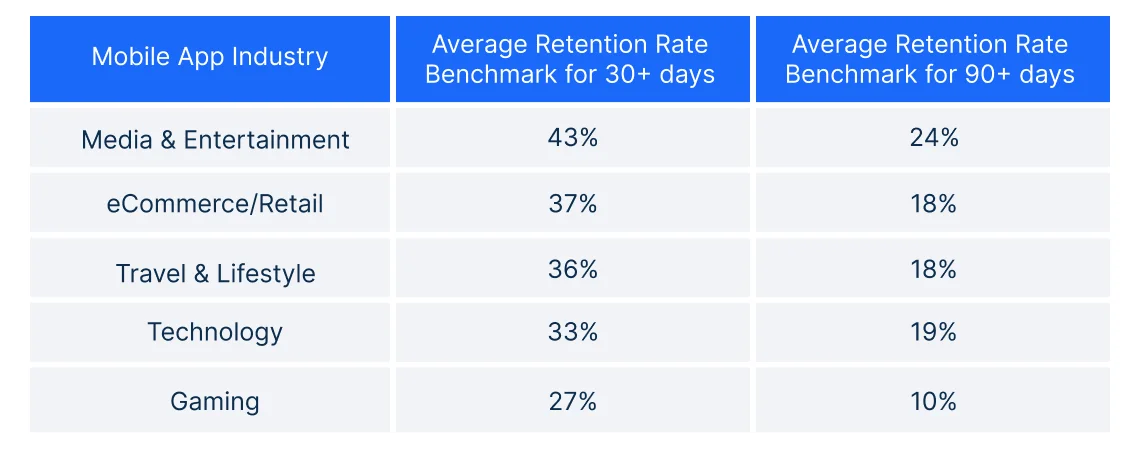
So, to ensure a better mobile app user retention rate continuously, you need to check the factors leading to better mobile app growth as explained in the given-below topic.
Mobile App Growth Statistics 2024
Now you know that smartphone users spend their majority of time on mobile apps for various functions. However, you would also want to know the factors motivating smartphone users to stick to their favorite mobile app. This study would help you get ideas to make your mobile app solution even more productive.
Mobile App Features and Functionalities
1. Attractive Mobile App UI/UX Designs
The mobile UI/UX design trends are the most fluctuating once. In the past few years, mobile UI/UX designs have advanced a lot and are becoming a major factor in the success of your mobile apps. With such, the market competition for the best mobile app UI/UX to ensure maximum user retention rate is also growing rapidly.
The leading mobile app UI/UX statistics say:
- A Good UI design helps to increase application conversion rate by 200% and UX design by 400% (Forrester Report)
- The ROI ratio from UX is 9,900% (Forrester Report)
Latest Mobile App UI/UX design trends you can try on your solution
- Use of in-app gestures (like Double Tapping, Dragging, Flickering, Swiping, Touch & Hold, Bottom Swiping, Swiping for switching screens, Swiping from the top, etc) borrowed from your mobile OS type (iOS & Android Gestures)
- Use of AR in UI: The augmented reality implementation in UI has been increasing since 2019. In that year (2019), the AR users were counted at 0.44 billion but are now expected to grow to 1.73 billion by 2024.
- Use Illustrations in UI for better impactful user experience.
- Use Bitmozies and other cartoon characters for the rewarding application user experience.
2. Best Performance
For the success of any mobile application, the best performance in terms of faster and crash-free operations is the key. In today’s fast-forwarding world, mobile app consumers demand to have applications that release new updates frequently, provide a rewarding app user experience, and meet their every needs coming in line.
When there is such an intensive mobile app market competition going on, your mobile app performance is the only key.
- 30% of mobile app users want their favorite app to load in just a fraction of seconds
- 49% of mobile app users might wait for an app to load if it takes around 2-3 seconds or max by 5 seconds
Not meeting such app loading speed might cause a loss of your potential loyal mobile app users.
As per Think with Google’s report, on average, users have around 35 apps installed on their smartphones.
With such installs, around 51% of smartphone users are highly likely to use brand-specific apps to make purchases to earn reward points for better discounts for future purchases.
3. Platform Dedicated Audience
Now, you already know that the android and iOS platform audience count at the latest by region with their successful user base retention ratio. Hence, it is important to choose your app development type wisely. You also know the mobile app development cost for Android and iOS apps, in which, indeed, iOS app development rates are a bit higher.
If we look on the bright side, to get incredible revenue generation, you do have an option for cross-platform or hybrid mobile app development. This option is more cost-effective than native app development and helps you generate revenue from all app hosting platforms.
Read also: Native vs Hybrid App: Which One is Ideal for App Development?
Be With the Mobile App Development Solutions’ Success Trends
After learning about mobile app development and business revenue generation, you might feel motivated to develop your own mobile application. Do you have any idea about the app development type? In simple terms, “what kind of mobile app do you want to build?” Let us make your research work easy.
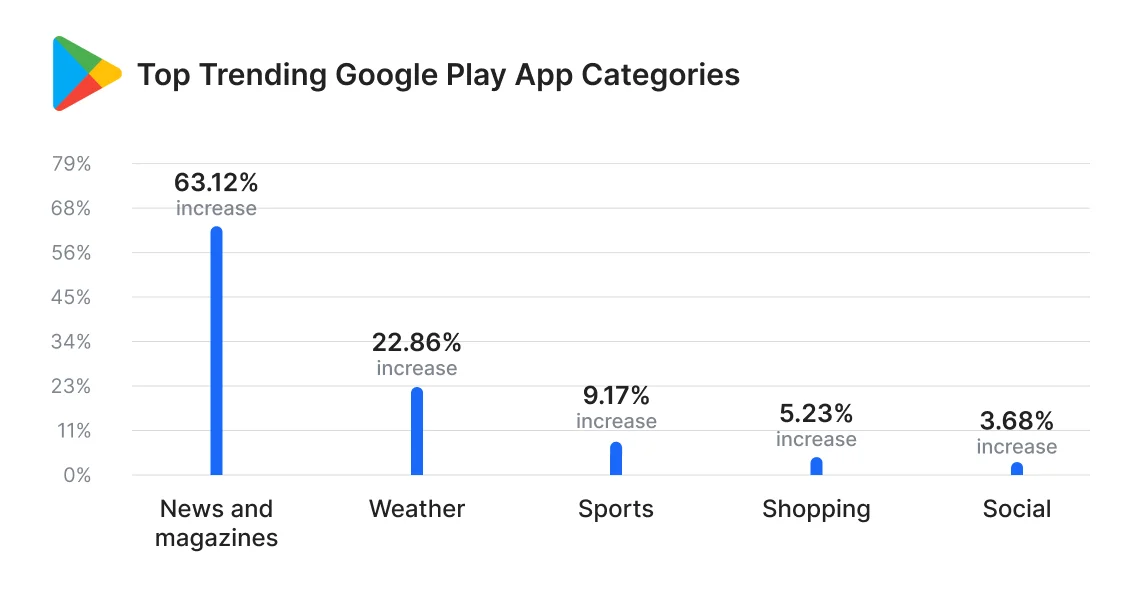
Google Play Store:
As per one latest study, news and magazine, weather, sports, shopping, and social app categories have received an increase in popularity in Google Play Store App categories.
For Apple App Store:
If looking for the all-time top trending app categories in the Apple App Stores, then out of 26, games, business, utilities, education, lifestyle, food & drink, and health & fitness categories are receiving anticipation from iPhone users.
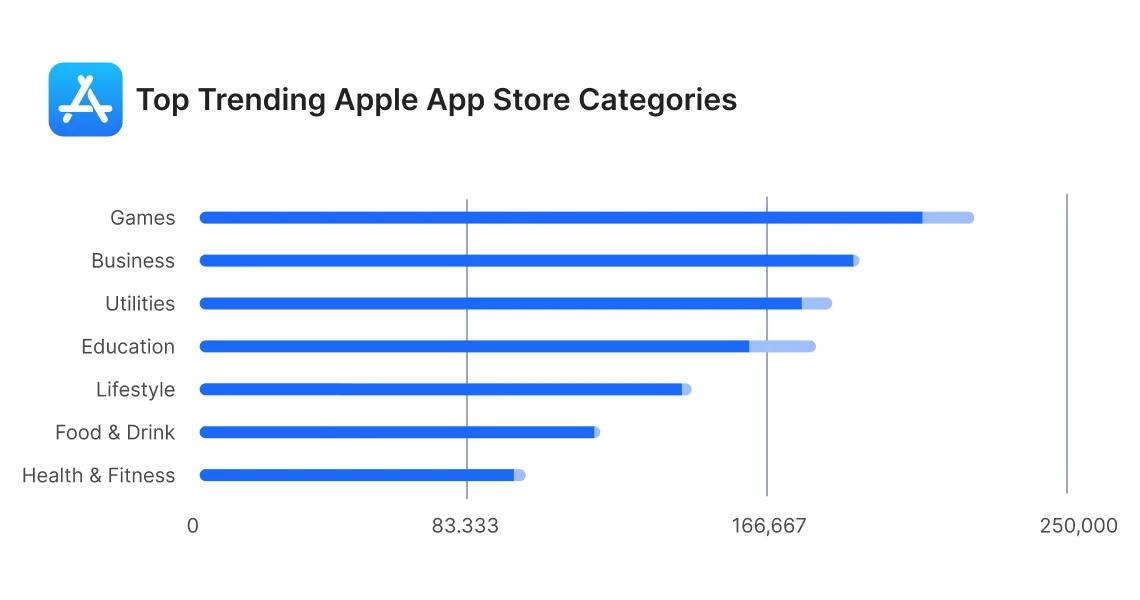
By following these mobile app ideas and industry types, you can build the most revenue-generating app. For better insights, refer to the below mobile app statistics and development ideas.
1. Social Media Apps
Social Media applications were famous from their inception, starting with Facebook. Today, social media platforms have become an integral part of our life for our entertainment, networking, and marketing purposes. Did you know that nine out of ten people spend their 4-5 hours daily scrolling social media?
There is no doubt that the short social media videos, shorts, reels, etc., have doubled the global digital userbase’s time spent on social media platforms. And what social media platforms does that include?
Without an extensive survey, we can get that answer from ourselves and the people in our surroundings. Wherever we go, we will find the majority of social media users using applications, including Facebook, Instagram, Threads, Twitter, Snapchat, etc.
As per Backlinko’s study, around 93.5% of 5.3 billion global internet users and 88.4% of 5.6 billion smartphone users have social media accounts, out of which 61.4% of the global population is currently utilizing social media actively.
If we look for the top social media platforms of 2023, Facebook ranked in the top position with 3.03 billion active users worldwide, followed by YouTube and other platforms.
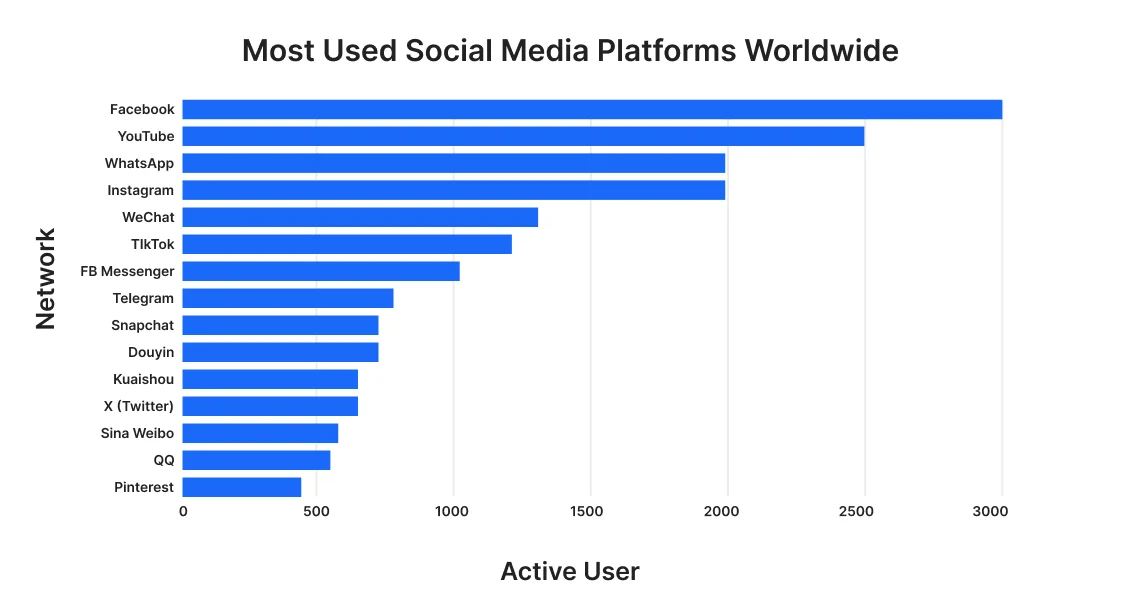
Seeing such success rates of social media platforms, you do have a chance to rock in the market by developing a well-thought social media platform like Instagram that can benefit the global user base.
2. Messaging, Chatting, Video Calling Apps
Online chat or messenger apps and video calling apps have connected the world. They have narrowed it down for people living in distant locations to connect over the internet through such online chat apps and make real-time conversations. Now that all online chat apps also provide HD video calling facilities, their usage has extended a lot globally.
We all know that whenever there is a talk about an online real-time chat application, WhatsApp comes first to our mind. To know more about popular real-time online chat applications, see the below-mentioned social media mobile app usage statistics about their global user base:
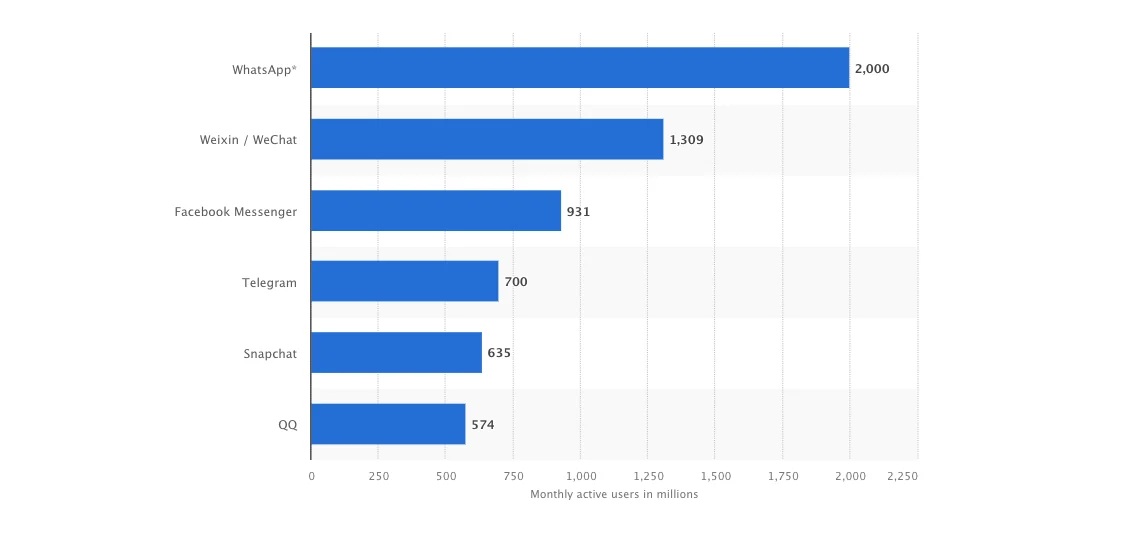
(Source: Statista – Most popular global mobile messenger apps as of January 2023, based on a number of monthly active users)
3. Video Streaming Apps
We all need entertainment for ourselves. And when we get to access global entertainment programs, series, movies, and documentaries in one app, why would we not wanna use it! Speaking of Over The Top (OTT) Services or online video streaming apps, YouTube, Netflix, Amazon Prime Video, Disney+ Hotstar, AppleTV+, etc., like global platforms are the ones we use the most regularly.
As per Statista, the OTT video marketplace is expected to reach US$325.40bn by 2024 and US$419.90bn by 2028 at a CAGR of 6.58% for the period 2024-2028. The user penetration ratio will be around 47.8% in 2024, which may increase to 54.7% 2028.
There are countless online video streaming platforms available in the market, but here, we’ll target top-rated OTT platforms at the global level, which we discussed above.
- As of the latest, in Q32023, the revenue of the YouTube channel has been counted at $7952 million, which shows approx 12.45% increase in one year. Moreover, it has 80 million subscribers for both YouTube Premium and YouTube Music.
- As per Statista survey, during the Q32023 Netflix generated revenue of approx $8.54 billion, which went up from $7.93 billion reported in the same quarter of 2022. As of Q32023, Netflix had provided its online streaming services to 247.2 million paid subscribers globally and may reach 253.79-259 million subscribers by Q42024.
- In 2023, Disney Plus generated an annual revenue of 8.4 billion with 157.8 million subscribers globally.
- Amazon Prime Video has been experiencing steady growth from the start. But by introducing new collaborations with global entertainment industries, it might hit $100 billion worth of OTT platform generation by 2026-2027 and may reach $1 trillion worth of marketplace in a few years or by the next decade. No doubt, it has been the strongest competitor to Netflix over the years.
With a growing expectation of entertainment services, there are indeed chances to create better business opportunities by building an OTT mobile app like Netflix.
4. Financial Apps (E-wallets, NetBanking, Stock Market)
After online video streaming services providing applications’ stats, financial apps are largely used by global mobile users. As per one study, it is found that 6 out of 10 people prefer to use online finance apps to manage their finances. After the e-transaction is made easily accessible and convenient, their usage is expected to rise in the following years.
As per Forbes report, over 50% of consumers prefer to use digital wallets to make their transactions. Moreover, the most preferred digital payment wallets are Google Pay (56%), Apple Pay (53%), and Samsung Pay (52%).
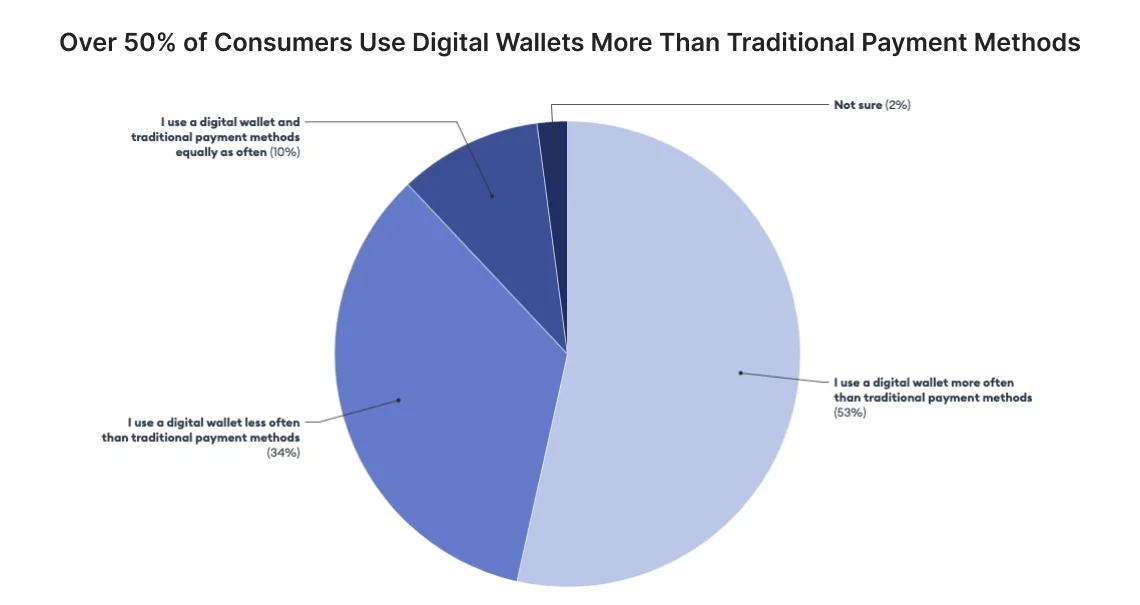
With such success rates, the personal financial software marketplace is expected to hit $4.2 billion worth by 2032 at a CAGR of 12.2% (2023-2032).
The global e-trading mobile app market has been projected to increase by 6.4% each year with an estimation of $13.3 billion worth of marketplace by 2026.
With the regular internet payment methods, decentralized internet payment systems like Cryptocurrency also seem like gaining popularity, with 420+ crypto owners worldwide at the latest.
The major countries of these crypto owners are as follows with respective data:
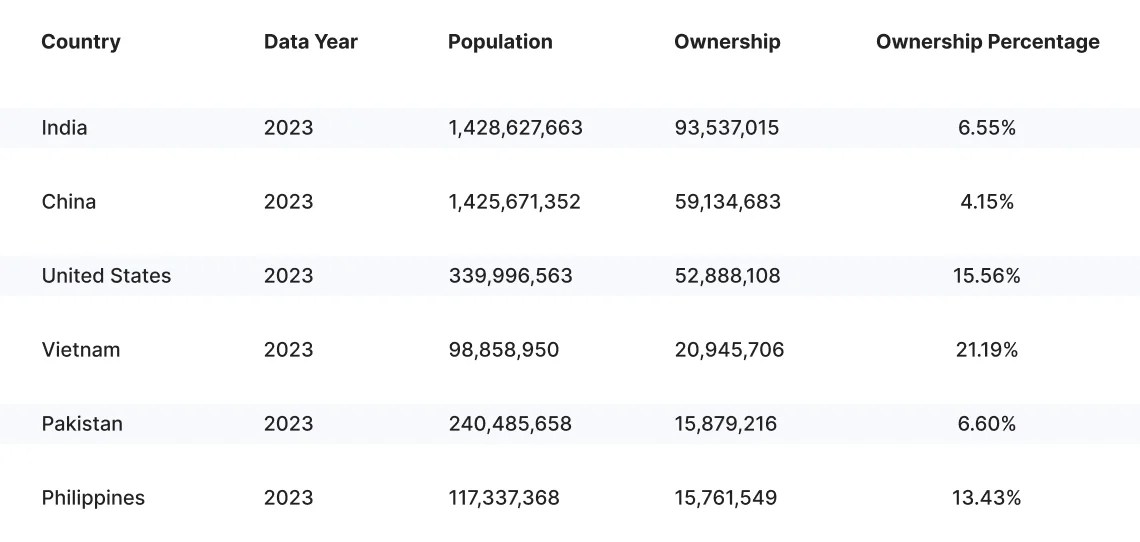
Seeing the growing popularity of crypto platforms, it also becomes evident to check out blockchain development trends that supercharge your digital finance projects.
5. On-Demand Apps (Booking, Delivery, E/M-commerce)
After the COVID-19 pandemic, the user base of on-demand services providing apps has increased a lot, especially in the online booking (hotel accommodations, services booking, etc.), online shopping apps, food/grocery delivery apps, etc.
Because of the extensive applications and increasing popularity of on-demand services, its on-demand apps revenue will increase to $335 million worth by 2025.
As per the latest Statista study, the number of users for online food delivery apps is forecasted to increase to 2.5 billion by 2028.
Moreover, European on-demand app marketplace spending is expected to hit $1.8 trillion worth by 2025.
Also, the on-demand app market creates many new business opportunities for the rising entrepreneurs and helps them to make better business in the upcoming years at the global level.
6. Gaming Apps
In our free time, we all enjoy playing mobile games to freshen up our mood, whether it is a popular mostly played Candy Crush, Card Games, War Games (PUBG, Fortnight, etc.), or any other ones.
Speaking of which, the gaming market has a huge dedicated user base across the globe.
In 2024, the market size of mobile games is estimated to reach $98.74 billion at the global level and may reach $118.90 billion by 2027 at a CAGR of 6.39%. If mobile game user penetration is the concern, then the market may expect to receive anticipation of 22.1% in 2024 worldwide.
As per one survey, around 57% of gamers play games on mobile from the 66% of the global population that owns smartphones. In the latest survey, Statista shared that by 2027, there will be 137 million users who’ll play games on mobile, which is an 8% of percentage increase to the current data. So, there will be 1.9 billion new mobile game players by 2027.
According to the latest report, in Nov 2023, both the App Store and Google Play Store together counted mobile game downloads at 4.02 billion globally. In which Indian market topped the list with 726 million mobile game downloads, followed by the US at 2nd and the Brazilian market at 3rd position with 8.2% of downloads.
As per one survey done among mobile gamers in the US in 2023, 41% showed their anticipation for action games and 35% for casual games.
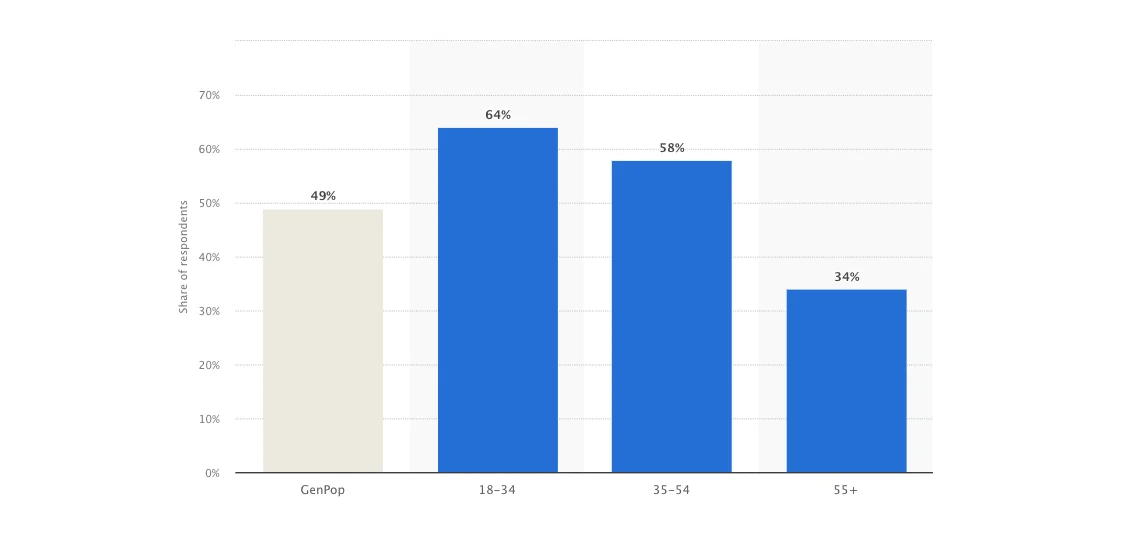
If we check gaming mobile app statistics age-wise, 49% of US gamers are GenPop, and 64% are in the age group of 18-34 who majorly play games through their smartphones and tablets.
The gaming industry is changing and has become a major revenue-generating business. The involvement of web 3.0 technology in the gaming industry is changing the paradigm by adding many new exciting gaming features and experiences.
Final Statement
With the increasing motivation toward mobility, mobile app development, and adoption rates will indeed skyrocket in the following years. The amalgamation of normal mobile apps and emerging technologies like AI/ML and data science and web 3.0 technologies will change the dynamics of mobile app industry statistics and its growth in terms of user experience, performance, and security extensively. So, that was all about mobile app usage and growth statistics and trends to take care of in 2024 and beyond.
Planning to build your dream mobile app? MindInventory can be your ideal mobile app development company, delivering cutting-edge solutions. Contact us to get an expert consultation to unlock endless possibilities for your mobile app idea.


