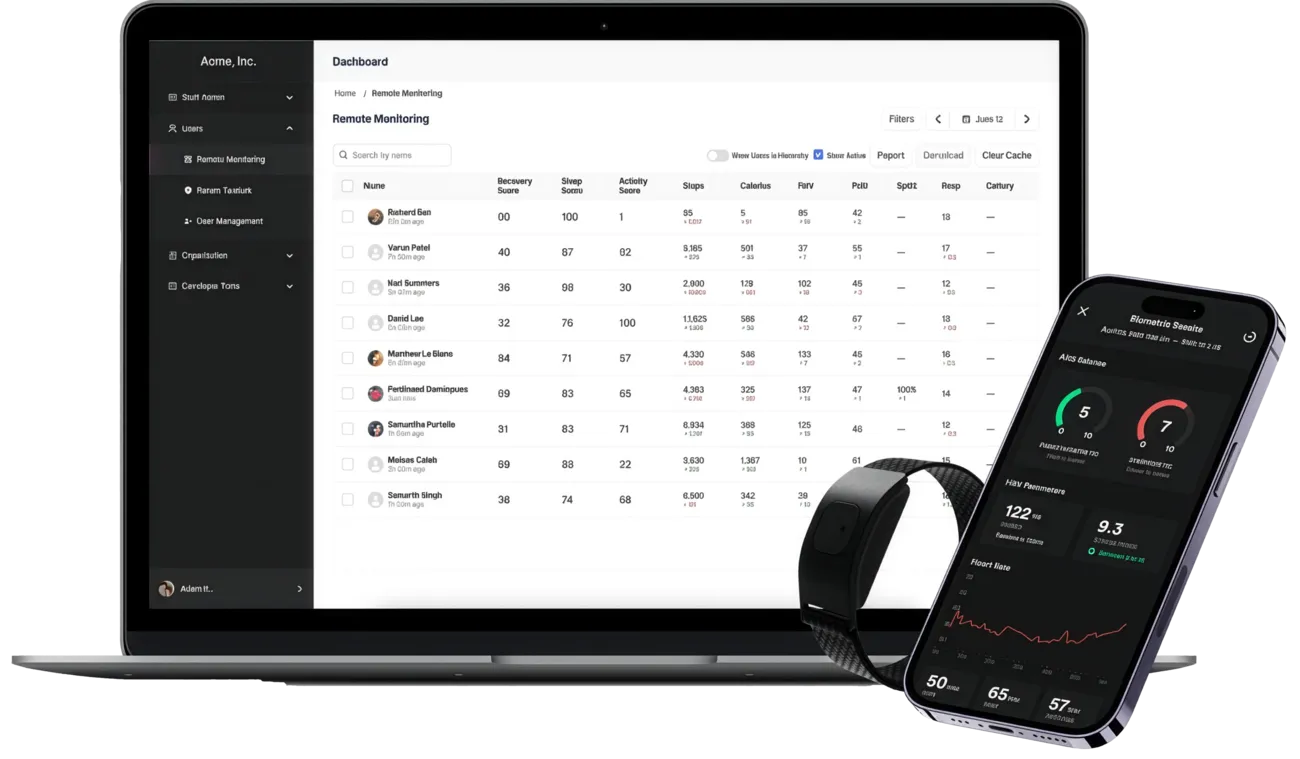
Biostrap health monitoring wearable device, mobile app interface, and clinical research dashboard mockup

How MindInventory Helped Build Biostrap’s Clinical Grade Wearable Health Data Platform

MindInventory partnered with Biostrap, now operating as Sensor Bio, working directly with CEO and Cofounder Sameer Sontakey on the engineering behind a wearable platform built for a use case consumer wearables cannot serve: giving researchers and clinicians access to the raw physiological signal, not just the number a device decided to display.

Most wearables compute a heart rate on the device and discard the waveform that produced it. Biostrap keeps it. That single architectural decision, preserving raw PPG, accelerometer and gyroscope data end to end and then processing it in the cloud rather than on a battery constrained wrist device, is what makes the platform usable in IRB approved studies and remote patient monitoring rather than fitness tracking. The platform is used by Stanford, UCLA, NASA, Pfizer, Tulane and the NIH, and today reports more than 400 million hours of captured data across 100 clinical studies.

Key takeaways

  • Key takeaway bullet arrow icon

    Engineering support across Biostrap’s mobile app, cloud biosignal pipeline, and the HIPAA compliant dashboard used by clinical and research customers

  • Key takeaway bullet arrow icon

    Raw PPG, accelerometer and gyroscope waveform data preserved end to end, rather than compressed into derived metrics on the device

  • Key takeaway bullet arrow icon

    A configurable data, survey and app layer that lets one platform serve first responders, sickle cell researchers and elite athletes without a separate build for each

  • Key takeaway bullet arrow icon

    Used by Stanford, UCLA, NASA, Pfizer, Tulane, CHLA and the NIH, with more than 400 million hours of captured data across 100 clinical studies

At a Glance

Founder :
Sameer Sontakey - Founder and CEO of Biostrap Sameer Sontakey CEO and Cofounder
Headquarters :
Los Angeles, California
Industry :
Digital Health, Wearable Technology, Clinical Research
Engagement :
Dedicated engineering team, working directly with Biostrap’s CEO
Services Provided :
Mobile app development Cloud biosignal pipeline engineering HIPAA compliant dashboard development API and SDK integration support
Compliance :
Checkmark icon HIPAA compliant platform Checkmark icon Used in clinical research and remote patient monitoring contexts
Recognition :
Featured in Forbes, Wired, Entrepreneur, and the Los Angeles Business Journal
Validation :
Independently validated against gold standard references including ECG chest straps

Clients

  • Stanford University Logo STANFORD
  • NASA Logo NASA
  • Pfizer Logo PFIZER
  • NIH - National Institutes of Health Logo NIH
  • UCLA Logo UCLA

400

Million hours of captured data

100

Clinical studies

Caduceus Medical Emblem - HIPAA Compliance Symbol

HIPAA
COMPLIANT

Research and monitoring platform

Why This Had to Be Built

Sameer Sontakey started Biostrap after losing close to 80 pounds and becoming seriously interested in his own physiology, then discovering that the wearables available to him were built to withhold exactly the data he wanted.

That is not a design oversight. It is the consumer wearable business model. A fitness tracker’s job is to show a clean number that makes the user feel informed, which means aggressive smoothing, gap filling, and proprietary processing that never leaves the device. It is the right call for a consumer product and it makes the data useless for research, because a researcher cannot distinguish a real physiological change from an artifact of someone else’s undisclosed filtering.

The people who needed that data had no good option. A university lab studying autonomic recovery, a clinician monitoring sickle cell patients between appointments, a health company trying to build a product on validated biometrics: all of them were choosing between a consumer device that hides its signal and building sensor infrastructure from scratch. Biostrap was built for the gap between those two. Research grade capture, raw data access, and a platform configurable enough that each of those very different users could run their own study on it.

The Challenge

Challenge bullet arrow icon Beat to beat precision, not averages

The metrics that matter clinically depend on millisecond accuracy in beat detection. Getting that from an optical sensor on a moving wrist is a materially harder problem than reporting an average heart rate.

Challenge bullet arrow icon HIPAA from the architecture up

Supporting remote patient monitoring and clinical research meant compliance had to shape the data model, not get audited onto it later.

Challenge bullet arrow icon One platform, incompatible use cases

Every enterprise and research customer wanted something specific. A custom build per customer does not survive the fifth customer.

Challenge bullet arrow icon Raw data access at clinical fidelity

Most wearables process and discard their raw sensor data. Researchers needed the underlying PPG and motion waveforms, timestamped and exportable, not a derived summary.

Challenge bullet arrow icon Configurability without forking

Every enterprise and research customer wanted something specific. A custom build per customer does not survive the fifth customer.

How a Heartbeat Becomes Research Data

  1. Step 1 badge icon 1

    Capture

    A validated biosensor captures raw photoplethysmography (PPG), accelerometer and gyroscope data continuously, at a sampling rate high enough to resolve individual pulse morphology, not just detect that a beat occurred.

  2. Step 2 badge icon 2

    Transmit

    Data moves off the device through the mobile app, which can be configured per customer for use case, branding and required survey instruments.

  3. Step 3 badge icon 3

    Process

    The cloud pipeline filters and cleans the waveform data, identifies and excludes motion corrupted segments, and derives biometrics from what remains. Raw data is preserved alongside the derived values rather than replaced by them.

  4. Step 4 badge icon 4

    Analyse

    Heart rate variability, respiratory rate, and autonomic nervous system balance are computed from the cleaned signal, measures that depend on the beat timing precision the capture layer was built to preserve.

  5. Step 5 badge icon 5

    Deliver

    Results surface through a HIPAA compliant dashboard for clinicians and researchers, or through APIs and SDKs for partners building their own products on validated data.

  6. Step 6 badge icon 6

    Validate

    For research and enterprise customers, the platform supports the full validation path, from study protocol design through publication, so product claims rest on data rather than assertion.

Engineering Decisions Worth Knowing About

Engineering decision arrow icon Raw waveform access as a first class decision, not an export feature

Preserving raw data end to end constrains everything upstream and downstream: sampling rate, on device storage, transmission bandwidth, cloud storage cost, and the data model itself. It is meaningfully more expensive than shipping derived metrics. It is also the only reason the platform can serve a researcher who needs to run their own analysis rather than trust someone else’s.

Engineering decision arrow icon Motion artifact handled by exclusion, not interpolation

A moving wrist produces optical noise that superficially resembles a pulse. The accelerometer and gyroscope streams are used as context for the PPG signal, so corrupted segments can be identified and dropped. Consumer devices tend to interpolate across them, because a gap in a chart looks like a broken product. In a study, an interpolated value is worse than a missing one. It is a fabricated data point that no downstream analysis can identify as such.

Engineering decision arrow icon Processing in the cloud, not on the wrist

Waveform level analysis takes more compute than a wearable can spend without either draining the battery in hours or cutting corners on the signal. Splitting the concerns, so the device captures faithfully and the cloud processes, means the analysis can be improved or re run across historical data without shipping firmware. For a two year longitudinal study, consistent reprocessing of the full dataset is worth more than a marginally faster result on the device.

Engineering decision arrow icon Configuration built into the platform, not forked per customer

Data parameters, survey instruments and app experience are configurable on top of a shared capture and processing foundation. That is what lets first responders, sickle cell researchers and athletes run on one system, and what keeps the engineering cost of a new enterprise customer close to zero.

Engineering decision arrow icon HIPAA in the data model

Compliance shapes access control, audit logging, retention, and how identifiers are separated from physiological data. Those decisions sit underneath the first chart ever drawn. Retrofitting them means rebuilding the data model, which is why they were made first.

Built for Research Grade Trust

A platform used by NASA, Pfizer and university research teams clears a different bar than a consumer fitness app. Biostrap’s device and algorithms have been independently validated against gold standard references, including simultaneous ECG recording under laboratory protocols. Validation is scoped to the conditions actually tested, because performing well at rest says nothing about performance during exercise.

Published research using the platform spans detecting COVID 19 symptom onset in biometric trends to monitoring pain episodes in sickle cell patients. That kind of work only holds up if data provenance, processing steps and methodology stay transparent enough for peer review, which is a constraint on the architecture as much as on the science.

The Results

Metric What It Means

400

million hours of captured data

Longitudinal capture at genuine scale, not pilot sized datasets

Results metric divider line

100

clinical studies

Real research adoption, with published outcomes rather than stated intent

Results metric divider line

Stanford, UCLA, NASA,
Pfizer, Tulane, CHLA, NIH

Named, checkable institutional customers

Results metric divider line

Validated

against ECG reference

Independently benchmarked against the clinical gold standard

Results metric divider line
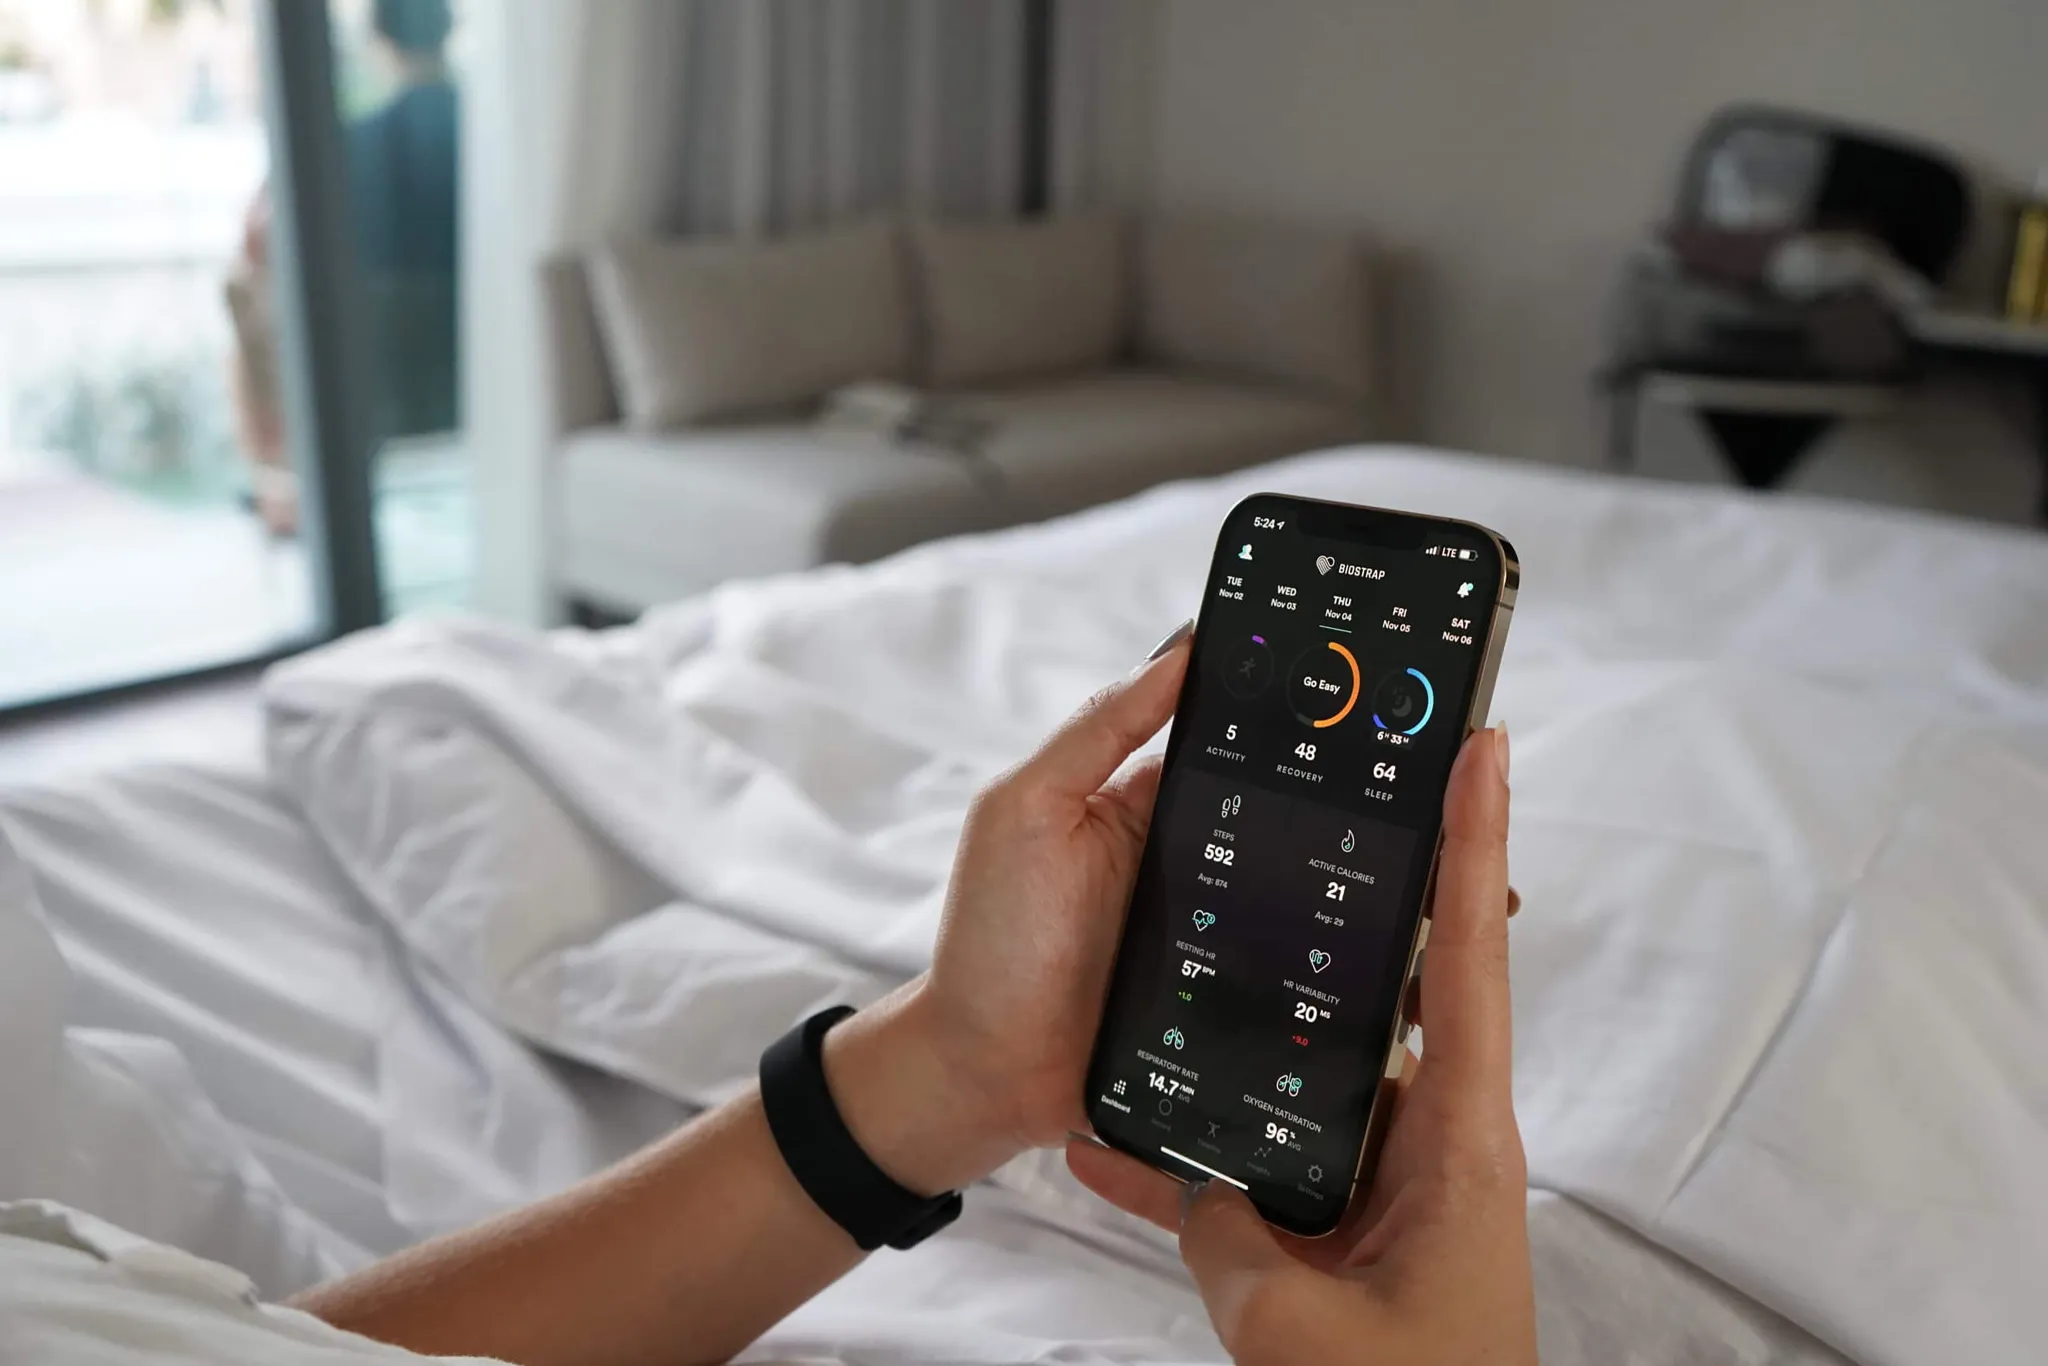
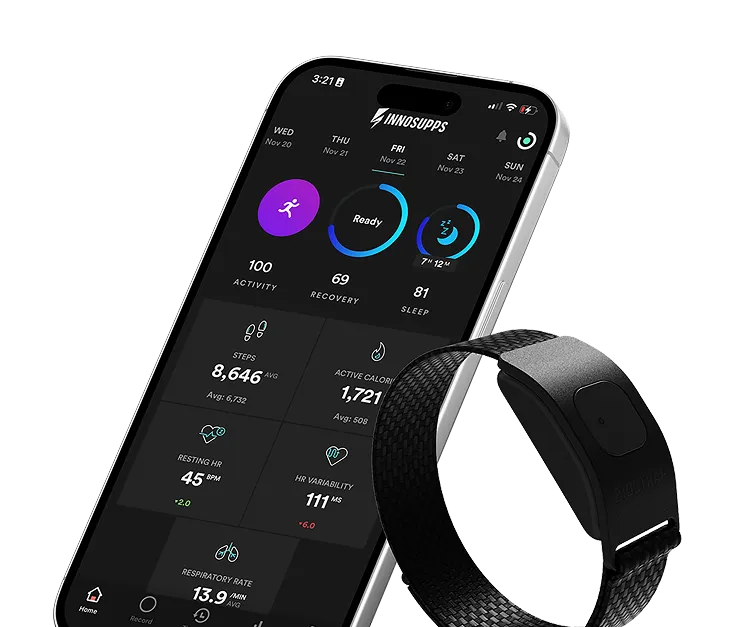
Biostrap health tracking wearable device on wrist alongside mobile app biometrics interface

Consumer wearables versus Biostrap’s platform

Matrix
Consumer Wearables Smartwatch Icon Consumer Wearables
Biostrap
Data access
Cross mark icon Derived metrics only
Checkmark icon Raw PPG, accelerometer and gyroscope waveforms, timestamped and exportable
Bad data
Cross mark icon Smoothed or interpolated to keep charts continuous
Checkmark icon Identified and excluded, so downstream analysis knows what is missing
Configurability
Cross mark icon Fixed experience for every user
Checkmark icon Configurable sensors, parameters, surveys and app per use case
Compliance
Cross mark icon Not built for clinical use
Checkmark icon HIPAA compliant, used in published clinical research

What Is Next for the Platform

    Platform roadmap spine connector line
  • Next roadmap arrow icon
    Expanded novel biometrics, pushing autonomic nervous system insight and stress resilience measurement further
  • Next roadmap arrow icon
    Broader API and SDK adoption, as more digital health companies build on validated data rather than building sensor infrastructure themselves
  • Next roadmap arrow icon
    Continued clinical validation across new use cases and populations

Frequently Asked Questions

What did MindInventory build for Biostrap?

FAQ minus accordion collapse icon FAQ plus accordion expand icon

MindInventory worked alongside Biostrap’s CEO on the platform’s mobile application, the cloud data pipeline that processes raw biosensor waveform data at scale, and the HIPAA compliant web dashboard used by clinical and research customers.

What is PPG, and why does raw access matter?

FAQ minus accordion collapse icon FAQ plus accordion expand icon

Photoplethysmography measures blood volume changes by shining light into the skin and reading what comes back. Every optical wearable uses it. The difference is what happens next. A consumer device runs the signal through proprietary filtering on the device, outputs a heart rate, and throws the waveform away. A researcher studying autonomic function needs the waveform itself, the morphology of each pulse, the exact timing between beats, the noise characteristics, because that is where the signal they are investigating actually lives. Once it has been averaged into a number, it cannot be recovered.

Why is heart rate variability harder to measure than heart rate?

FAQ minus accordion collapse icon FAQ plus accordion expand icon

Heart rate tolerates error. If a beat is detected 40 milliseconds late, the average barely moves. Heart rate variability is built entirely from those inter beat intervals, so a 40 millisecond timing error is not noise around the measurement. It is the measurement. That means beat detection has to be precise at the millisecond level, which requires a high sampling rate, a clean signal, and detection logic that does not quietly interpolate over beats it is not sure about. Most consumer variability numbers come from intermittent sampling and heavy smoothing, which is why they do not hold up in research.

How do you handle motion artifact in wearable biosignal data?

FAQ minus accordion collapse icon FAQ plus accordion expand icon

Motion is the dominant failure mode in optical sensing. A wrist moving during a walk produces optical noise that looks superficially like a pulse. Solving it means using the accelerometer and gyroscope streams as context for the PPG signal rather than as separate metrics, so the pipeline can identify which segments are corrupted and exclude them rather than average through them. The honest approach is discarding bad data and saying so. Consumer devices tend to interpolate instead, because a gap in the chart looks like a broken product. In a clinical study, an interpolated value is worse than a missing one.

Why process biosignal data in the cloud instead of on the device?

FAQ minus accordion collapse icon FAQ plus accordion expand icon

Battery and compute. Meaningful waveform level analysis takes more processing than a wrist worn device can do without either draining in hours or cutting corners on the signal. Streaming raw data off the device and processing it in a dedicated cloud pipeline separates the two concerns. The wearable’s job is faithful capture, the cloud’s job is filtering, cleaning and deriving biometrics. It also means the analysis can be improved, or re run against historical data, without shipping new firmware, which matters when a study needs consistent processing across two years of collection.

How do you serve one platform to first responders, sickle cell researchers, and elite athletes?

FAQ minus accordion collapse icon FAQ plus accordion expand icon

By building configuration into the platform rather than forking it. Each of those groups needs different data parameters, different survey instruments, and often a differently branded mobile experience, but they all sit on the same capture and processing foundation. The alternative, a custom build per customer, does not survive the fifth customer. Making the data layer, the survey layer and the app experience configurable is what turns a product into a platform.

What does HIPAA compliance require of a health data platform?

FAQ minus accordion collapse icon FAQ plus accordion expand icon

More than encryption. It shapes access control, audit logging, data retention, and how identifiers are separated from physiological data. Those decisions have to sit in the architecture before the first chart gets drawn, because retrofitting them means rebuilding the data model. For a platform supporting remote patient monitoring and clinical research, compliance is a precondition for the customer conversation happening at all, not a feature that differentiates it.

How is a wearable validated for clinical use?

FAQ minus accordion collapse icon FAQ plus accordion expand icon

Against a gold standard reference under controlled conditions. For cardiac measures, that typically means simultaneous ECG recording across a range of activity levels and physiological states, then statistical comparison of the two. Biostrap’s measurements have been independently validated against references including ECG chest straps and laboratory protocols. Validation is also specific to the use case. Performing well at rest says nothing about performance during exercise, which is why claims have to be scoped to the conditions actually tested.

Who uses Biostrap’s platform?

FAQ minus accordion collapse icon FAQ plus accordion expand icon

Research and clinical organizations including Stanford, UCLA, NASA, Pfizer, Tulane, CHLA and the NIH, alongside enterprise customers such as Therabody, Pepsi, Gatorade and Clorox. Published research using the platform spans detecting COVID 19 symptom onset in biometric trends to monitoring pain episodes in sickle cell patients.

Can MindInventory build a digital health or wearable platform for us?

FAQ minus accordion collapse icon FAQ plus accordion expand icon

Yes. We work as a product engineering partner on connected health products: biosensor data pipelines, mobile applications for continuous capture, HIPAA compliant clinician dashboards, and the API and SDK layers that let partners build on top of validated data. Biostrap represents the demanding end of that, with research grade fidelity, regulated data handling, and one platform serving clinical, enterprise and consumer contexts at once. Our other healthcare work includes Sully AI’s clinical AI workforce and Arrow’s agentic AI platform for revenue cycle management.

Ready to build your next digital health platform?

Talk to Our Digital Health Team
Biostrap health monitoring wearable device on wrist alongside smartphone app displaying biometric analytics